
Restoring Utah’s Historic Homes: A Guide to Authentic Masonry
Utah’s historic homes carry a distinct architectural character shaped by regional stone, early craftsmanship, and centuries of environmental exposur
Utah's real estate market is currently labeled a buyer's market, yet many prospective buyers feel otherwise. High home prices and elevated interest rates challenge affordability despite an abundance of homes for sale. This detailed analysis explores the latest housing market statistics across Utah, with a particular focus on Utah County, shedding light on supply, demand, pricing trends, and where opportunities lie for buyers and sellers in mid-2025.
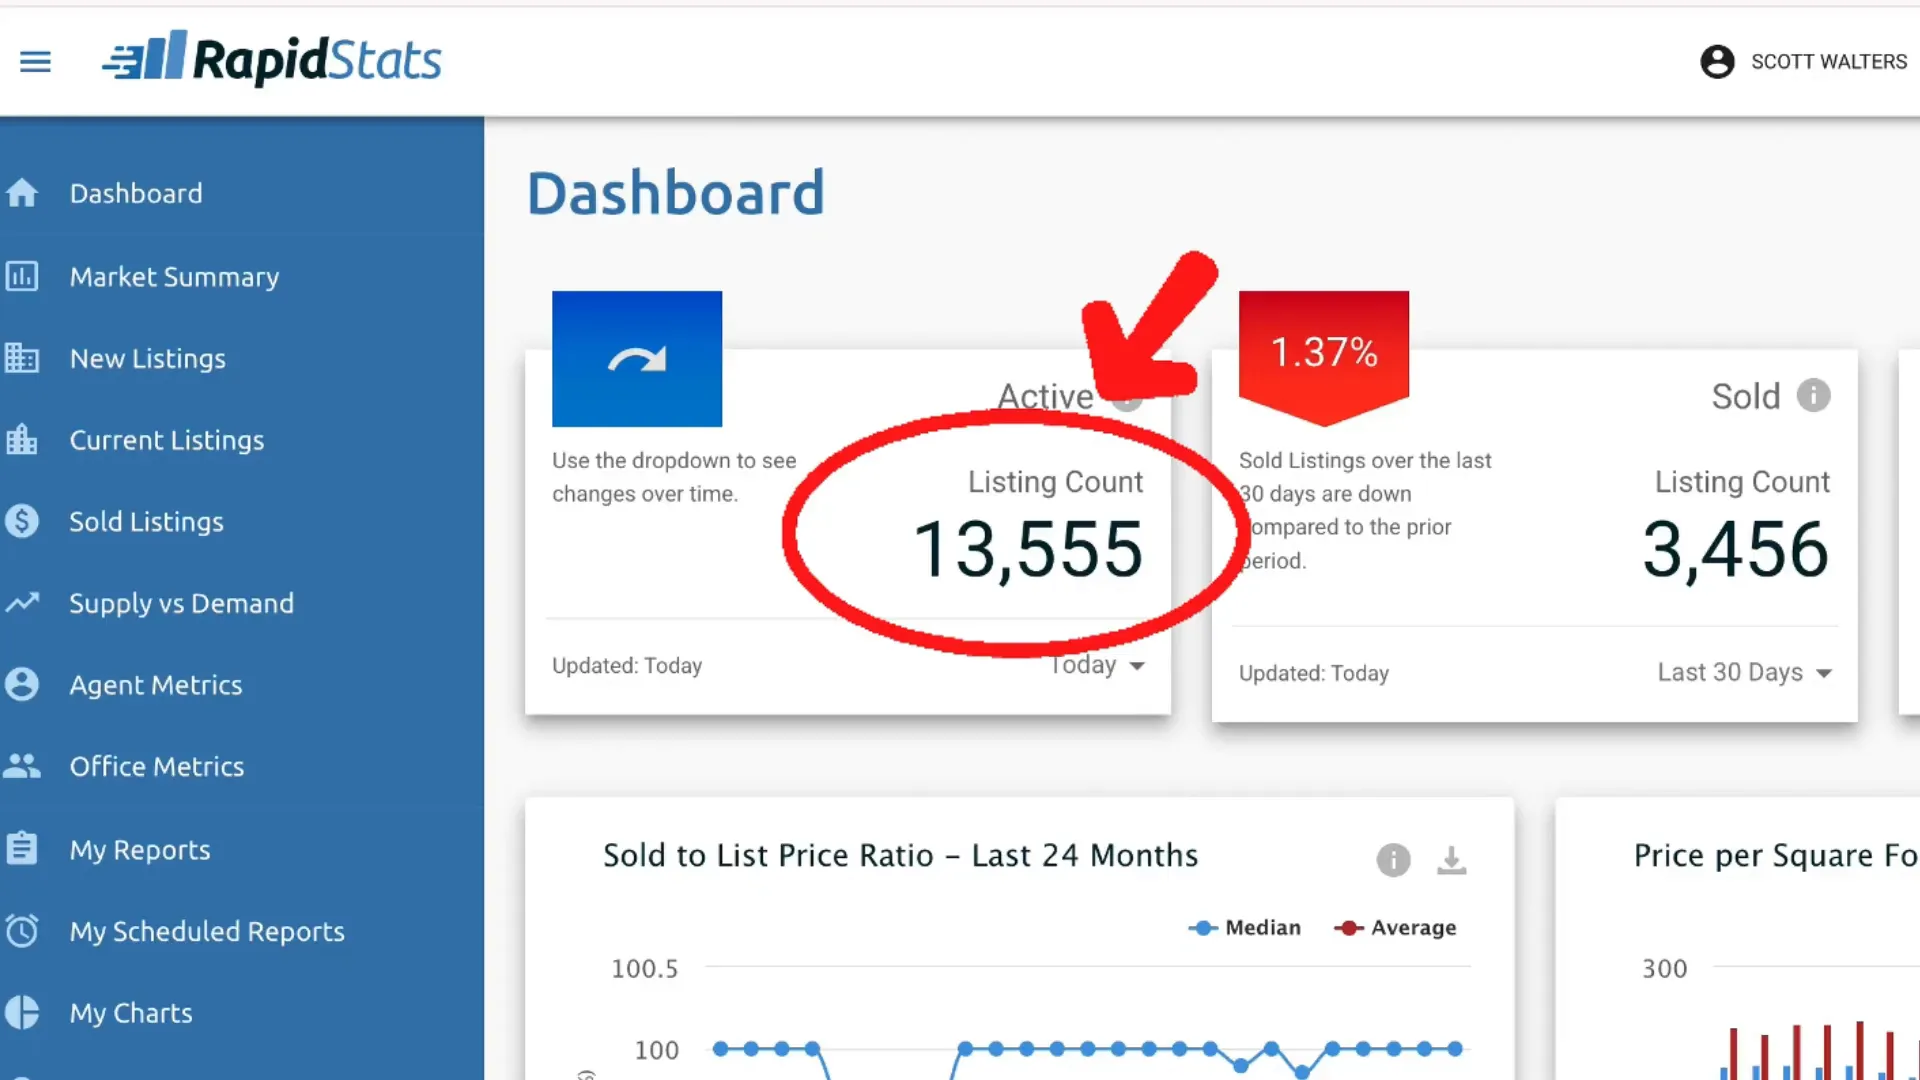
The primary Multiple Listing Service (MLS) for Utah is the WFR MLS, which covers most areas except Saint George and Park City, though many agents in those cities also subscribe to it. According to bestutahrealestate.com, there are currently 13,555 active listings statewide. Over the past 30 days, 3,456 homes sold, and 5,453 went under contract, reflecting ongoing market activity.
Examining the median sold-to-list price ratio over the last two years reveals that sellers are generally achieving close to 100% of their asking price. Although there were minor dips in early 2024 and 2025, by May and June 2025, the median ratio rebounded to nearly 100%, indicating steady seller pricing power despite market shifts.
Price per square foot has remained relatively stable over this period, hovering around $230 per square foot from June 2023 through June 2025. This stability suggests that while overall prices remain high, value relative to home size has not significantly escalated or declined recently.
The critical factor defining Utah’s current housing market is the relationship between supply and demand. Over the past 48 months, the month's supply of homes (inventory divided by sales pace) and the absorption rate (how quickly homes sell) have fluctuated significantly.
Between May 2021 and May 2022, demand far outpaced supply, sparking intense bidding wars where homes sold for well over list price—sometimes by $100,000 or more. Buyers often waived inspections and appraisals just to secure properties.
However, starting in July 2022, the market shifted as supply increased beyond demand. By May 2025, the month's supply rose to approximately 3.37 months, while the absorption rate dropped to about 29.66 months. This means if no new homes were listed, it would take nearly 30 months to sell the existing inventory, clearly indicating a buyer's market with abundant options available.
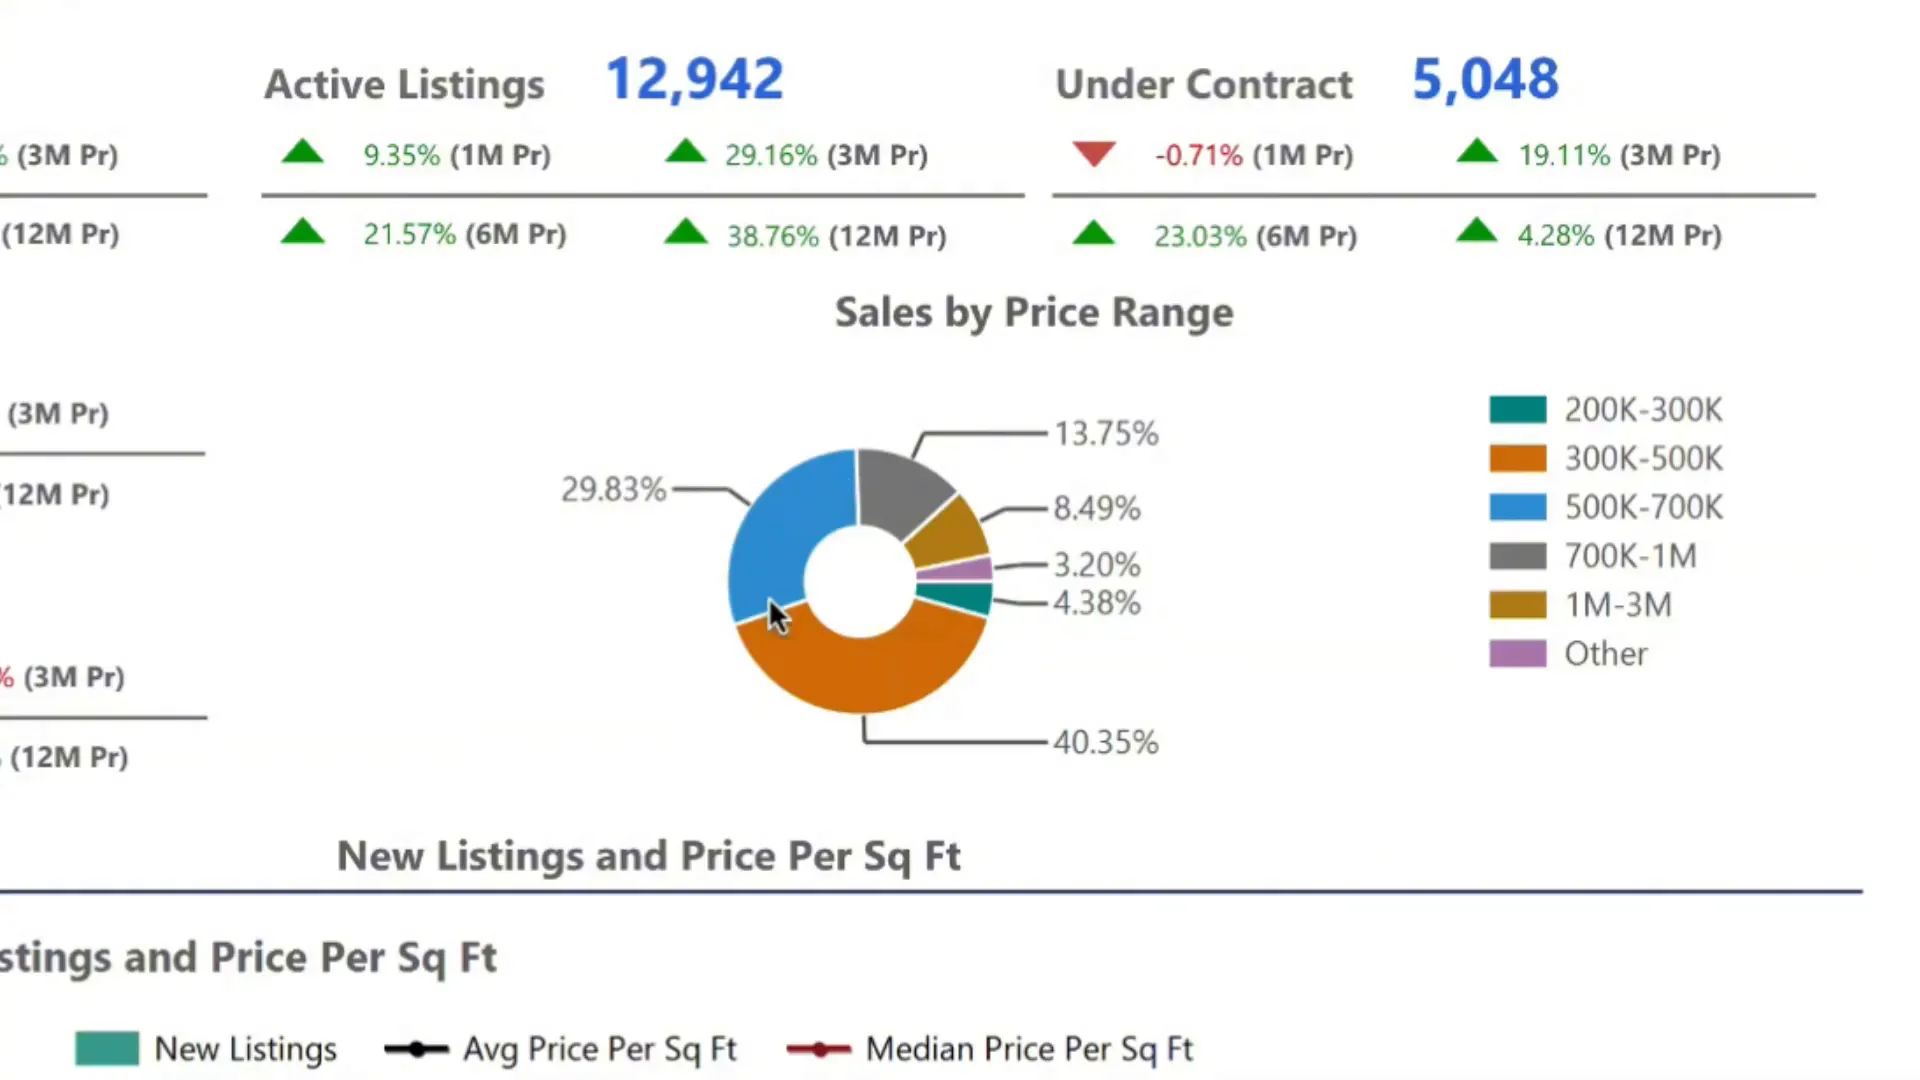
New listings statewide in May 2025 totaled 6,198, with 12,942 active listings and 5,048 homes under contract. The average days on market (DOM) rose to 56 days, reflecting longer listing times compared to previous years. This slower pace gives buyers more negotiating power.
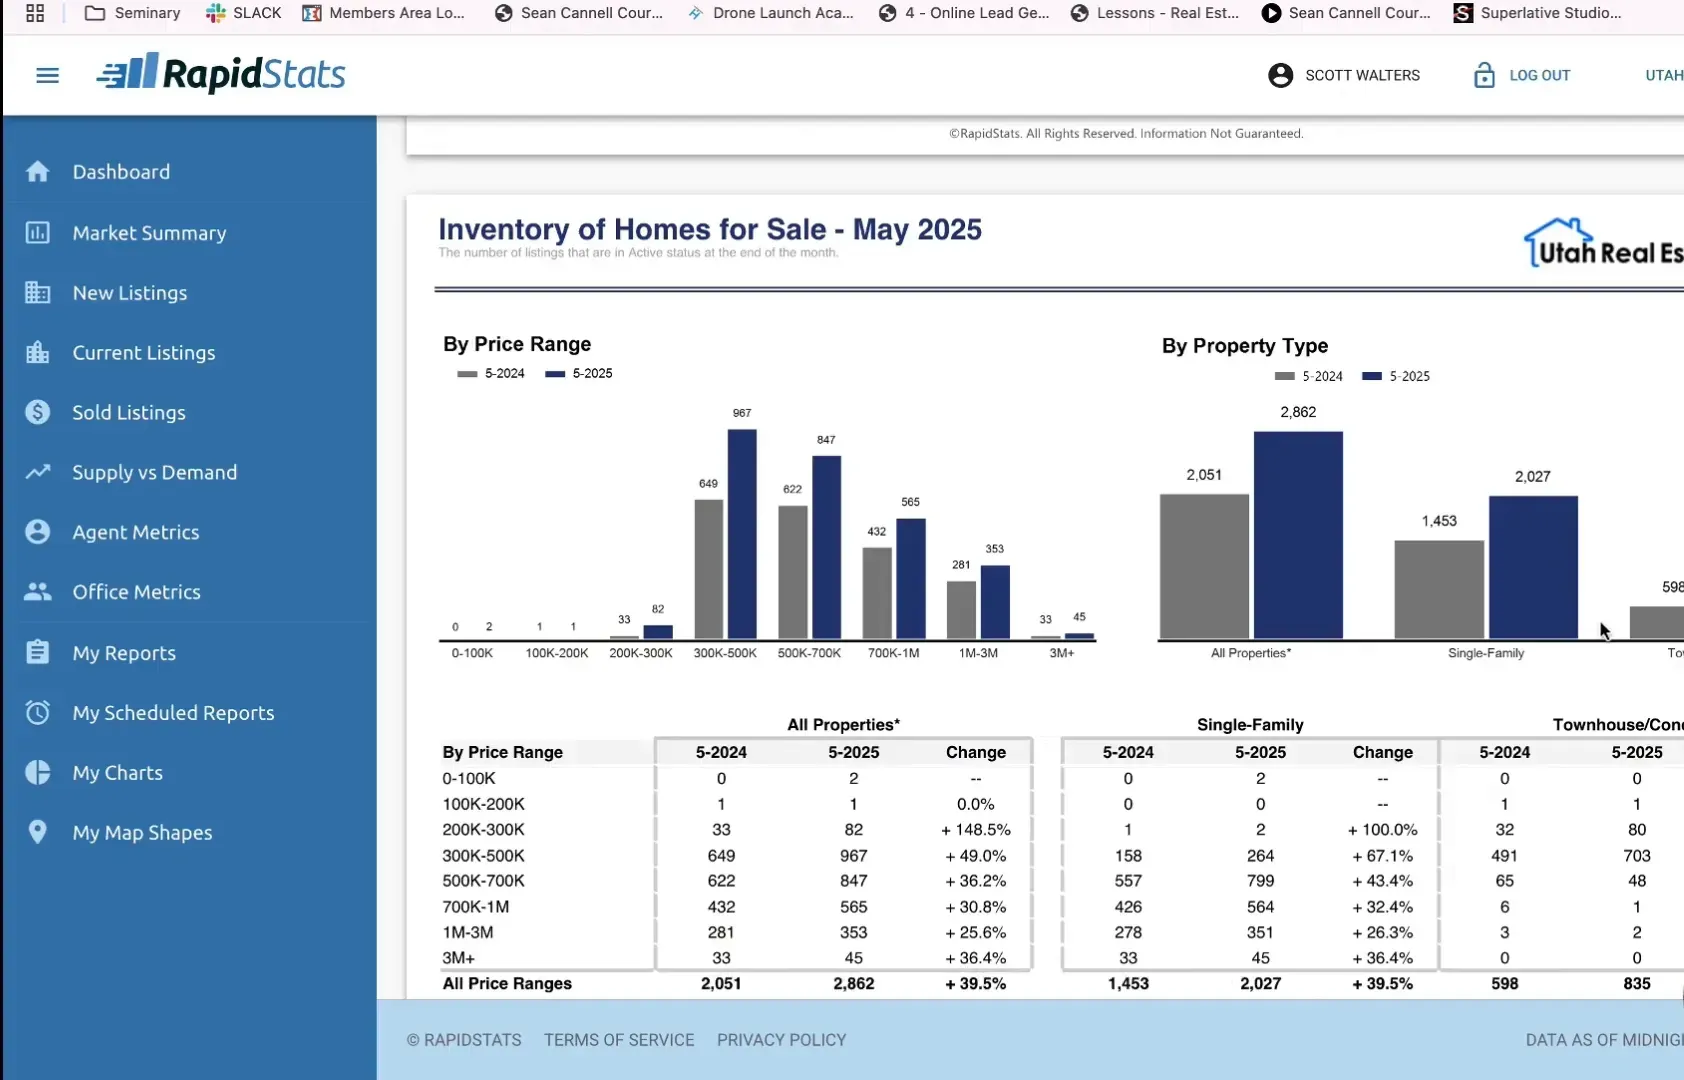
About 70% of homes sold statewide fall within the $300,000 to $700,000 price range. Specifically, 40.35% of sales occur between $300,000 and $500,000, while 29.83% are between $500,000 and $700,000. Homes priced under $300,000 account for a mere 4.38% of sales, mainly due to scarce availability in that range.
Interestingly, luxury homes priced between $1 million and $3 million make up 8.49% of sales, a higher proportion than homes under $300,000. Homes over $3 million represent about 3.2% of the market.
The single-family home median sales price remained stable, increasing only $5 from $574,995 to $575,000 year-over-year. In contrast, the townhouse and condominium market saw a notable price decline, with median prices dropping from $415,000 to $400,000. This segment presents excellent opportunities for buyers, especially with builders offering incentives such as interest rate buy-downs, upgraded appliances, and finished yards to attract purchasers.
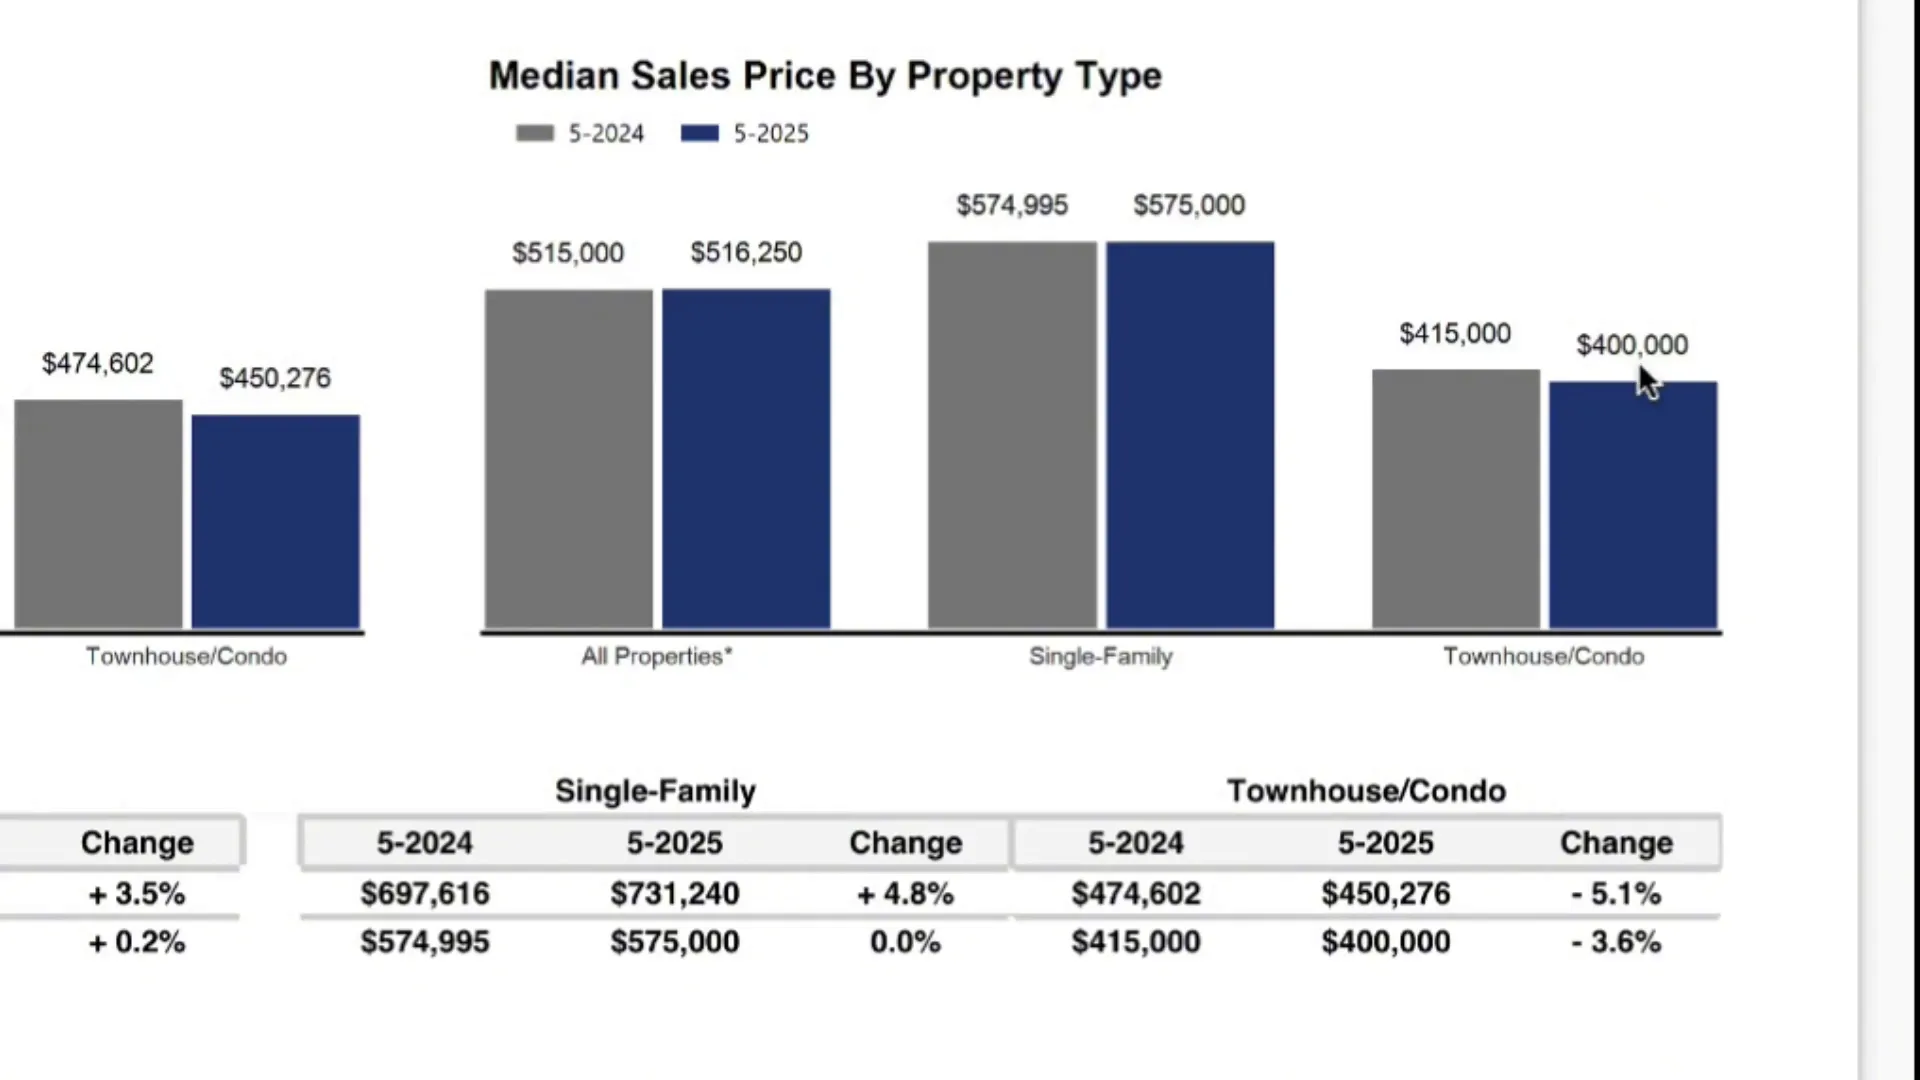
Townhomes and condos linger longer on the market, increasing from 48 to 62 days, whereas single-family homes average 53 days. This extended market time typically translates to better negotiation leverage for buyers.
Inventory for all properties surged from 8,702 to 12,127 active homes. Single-family homes increased from 6,394 to 8,895, and townhomes/condos rose from 2,308 to 3,232. Month's supply climbed from 2.4 to 3.3 months, confirming the shift toward a buyer’s market given the current absorption rate.
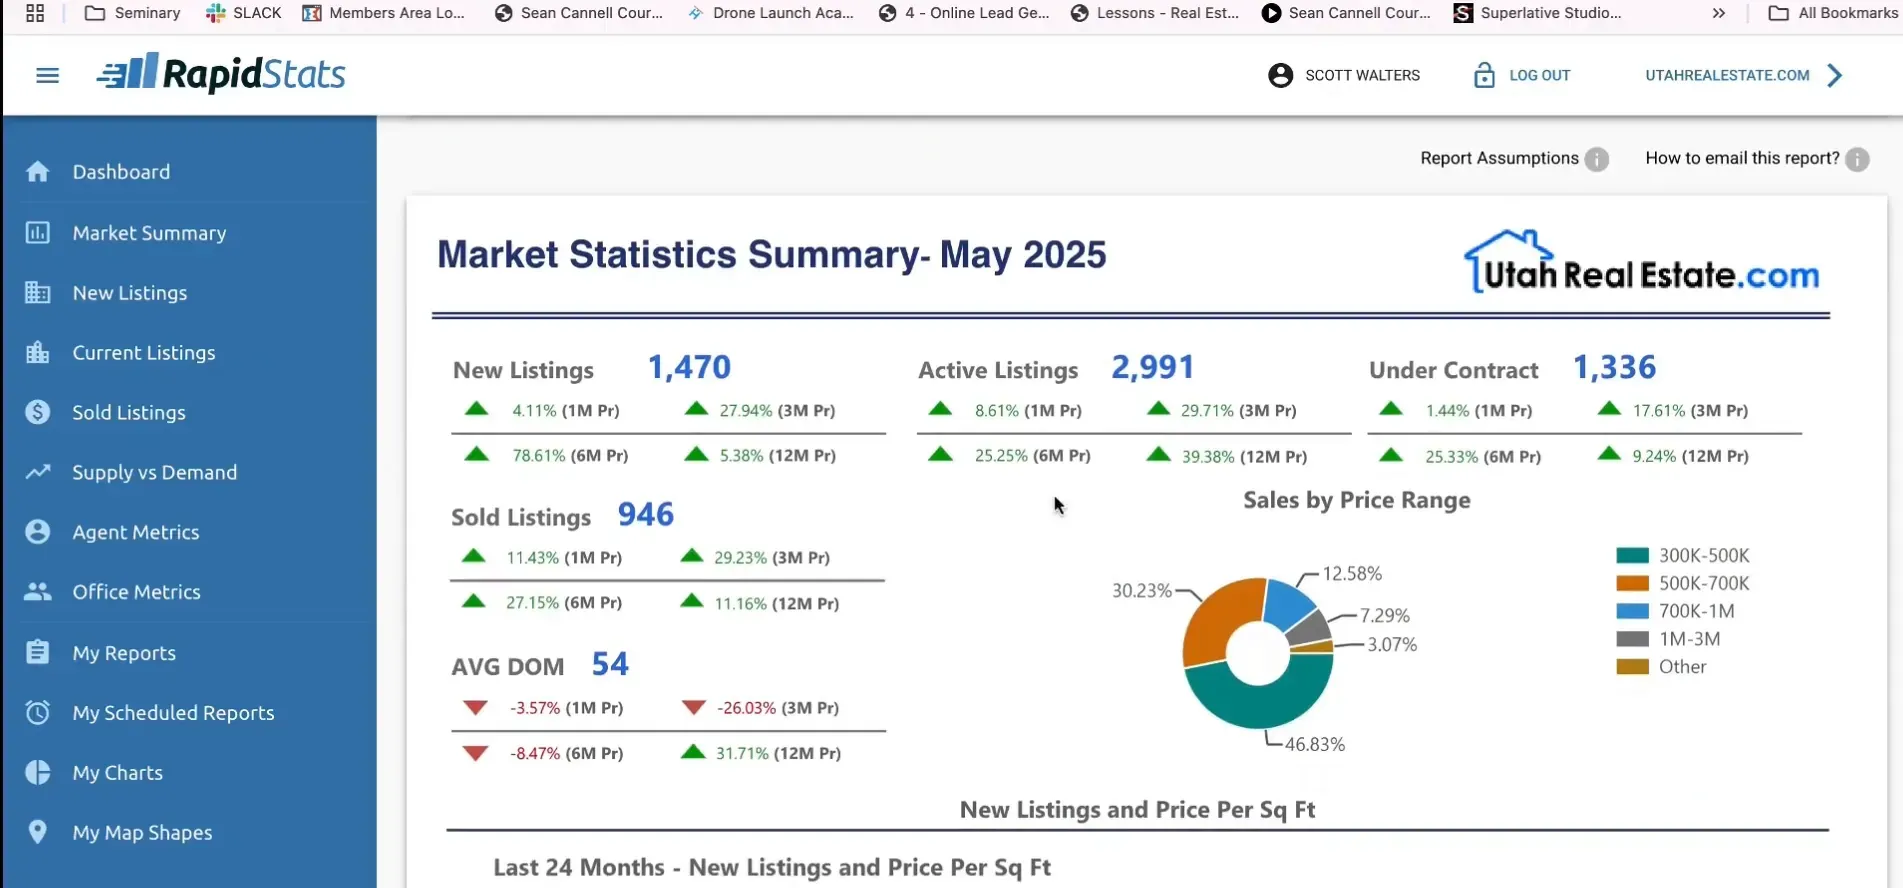
Utah County's market mirrors statewide trends but with some local nuances. In May 2025, there were 1,470 new listings, 2,991 active listings, 1,336 homes under contract, and 946 sold listings. Average days on market stood at 54.
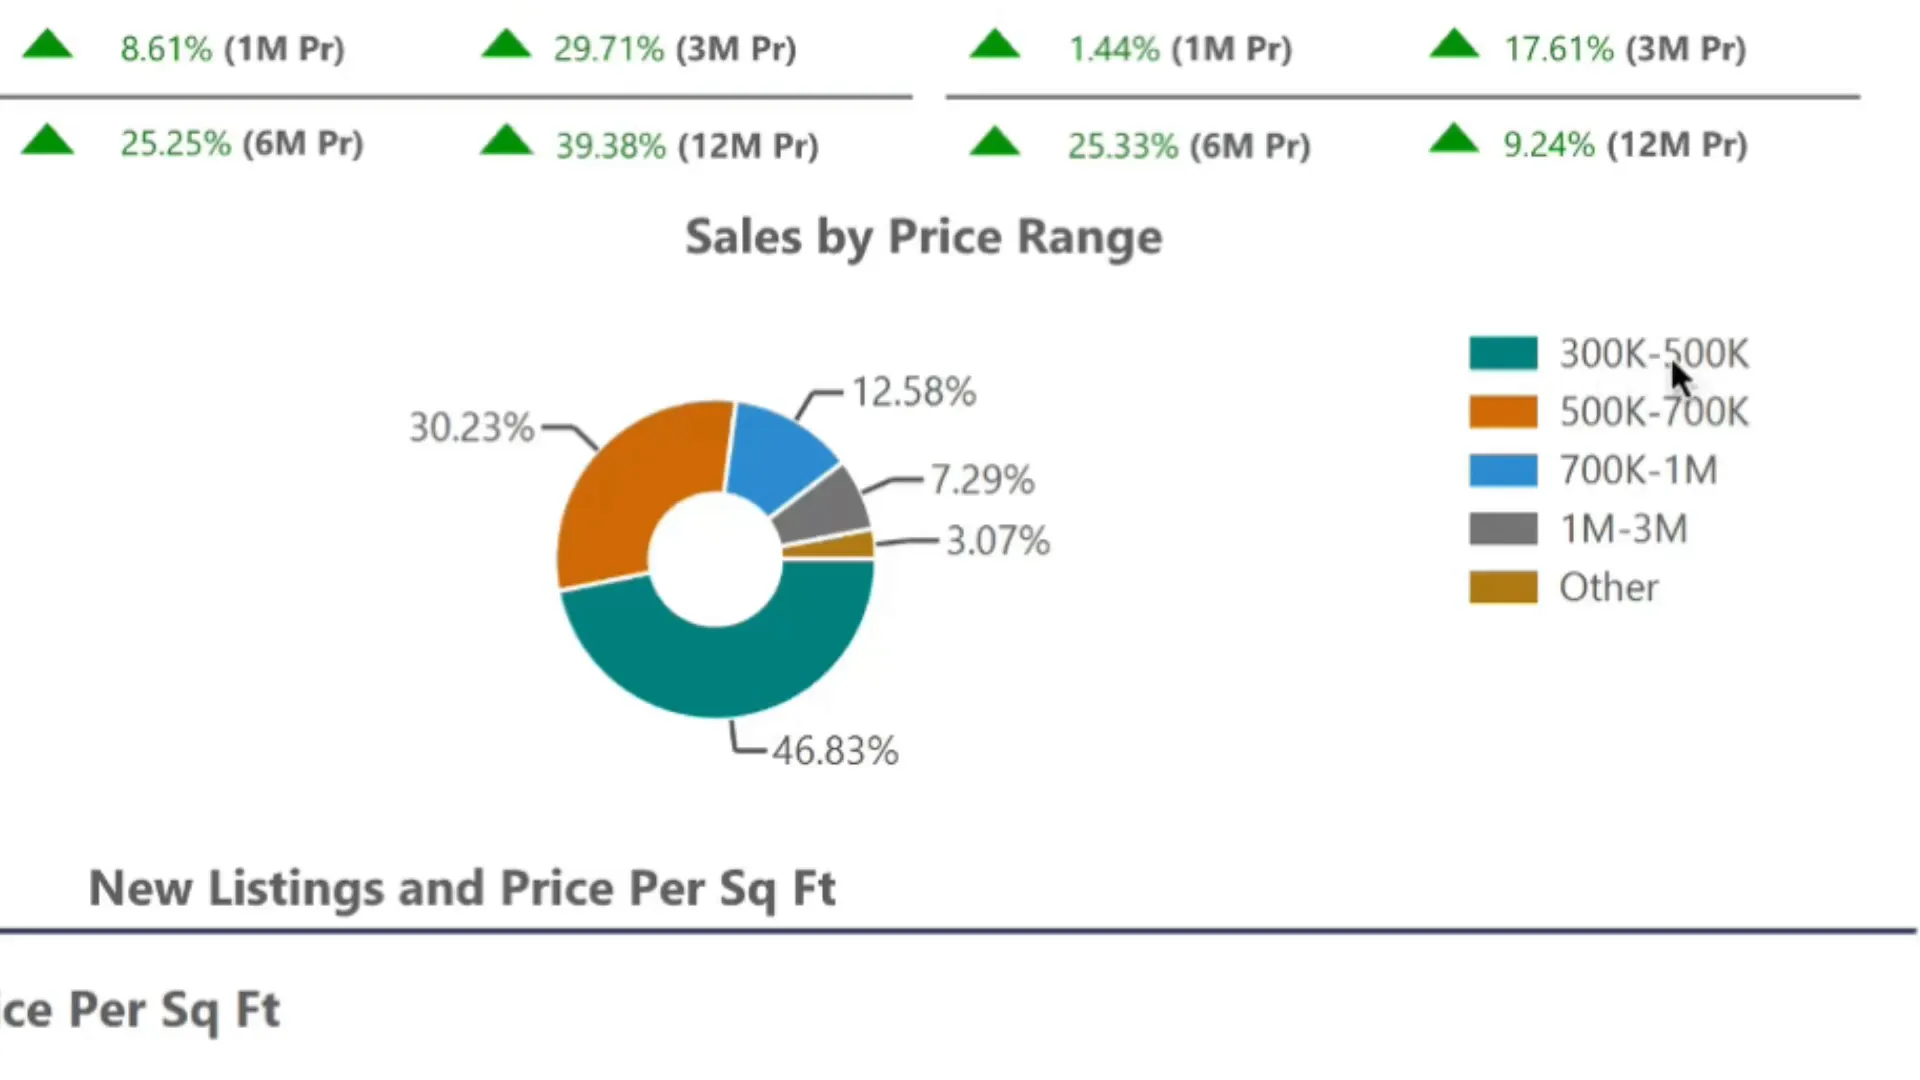
Nearly half (46%) of homes sold in Utah County fall between $300,000 and $500,000, predominantly condominiums. Between $500,000 and $700,000, 30.23% of sales occur, mainly single-family homes. Homes priced under $300,000 are virtually nonexistent in the area due to limited supply.
Homes priced between $700,000 and $1 million comprise 12.58% of sales, reflecting a healthy luxury segment in Utah County.
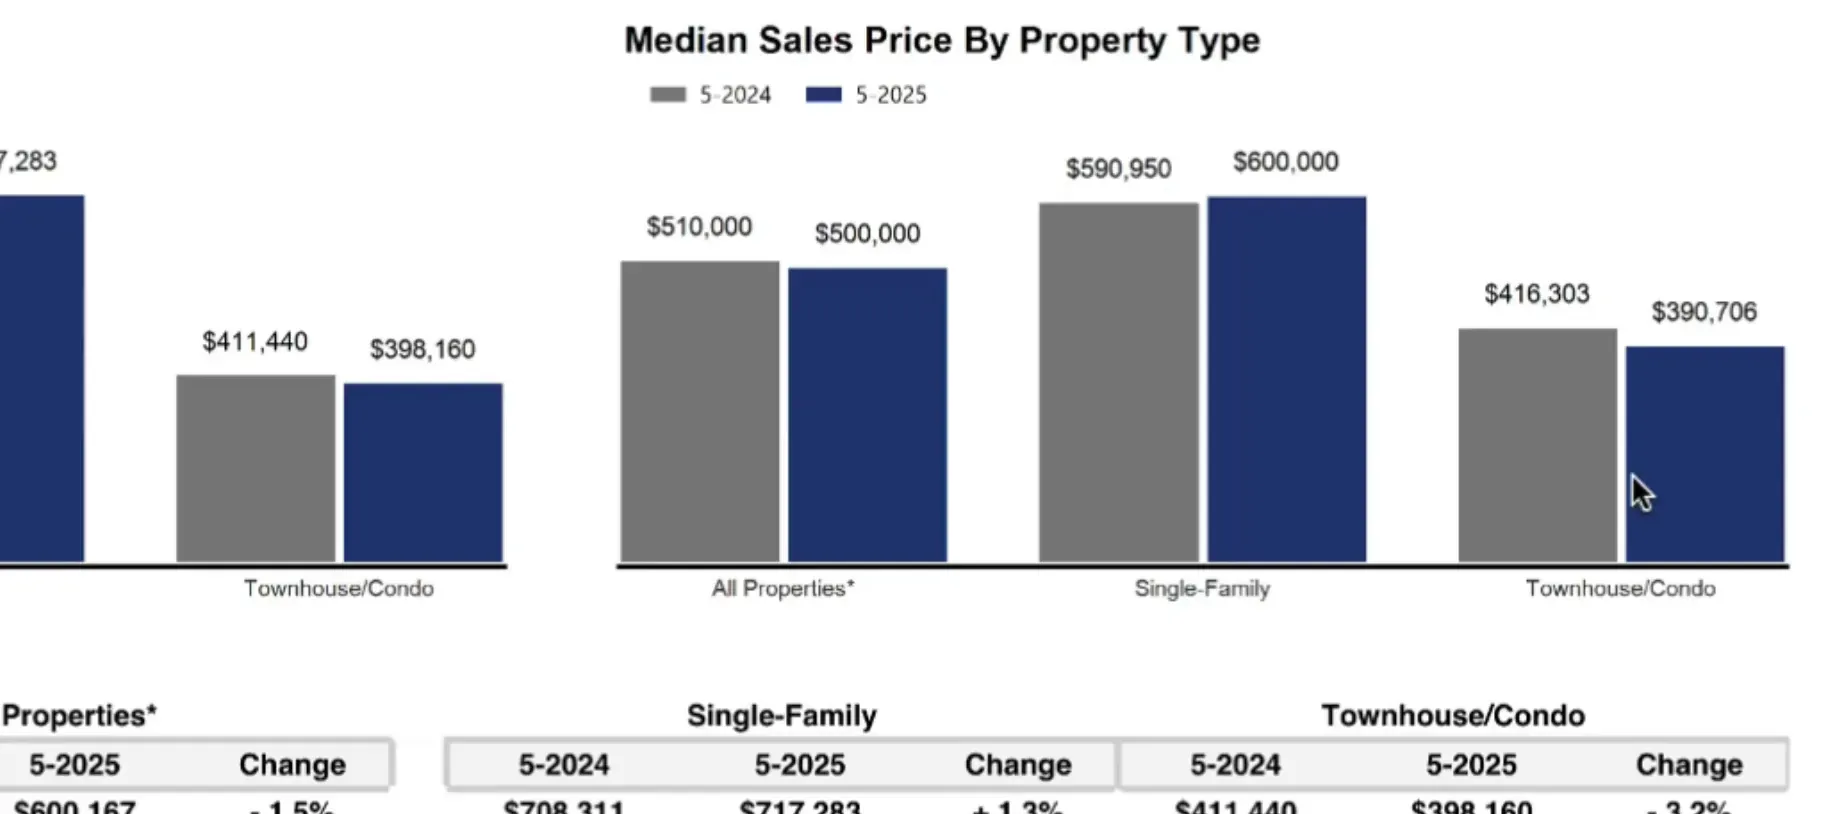
Median sales price for all properties slightly decreased from $510,000 to $500,000. Single-family homes saw an increase from $590,000 to $600,000, while townhouse and condominium prices dropped significantly from $416,000 to $390,000, emphasizing opportunity in those sectors.
Pending sales of all property types increased from 1,182 to 1,285, with single-family homes rising from 697 to 761. Townhomes also saw a minor increase in pending sales.
Inventory grew substantially, with active single-family homes increasing from 1,453 to 2,027 and townhomes from 598 to 835. Month's supply rose from 2.5 to 3.1 months overall, and single-family homes specifically went from 2.7 to 3.5 months supply.
Despite the technical classification of Utah as a buyer's market with over 29 months of housing supply relative to the absorption rate, many buyers feel squeezed due to persistently high interest rates and elevated home prices. Finding homes under $200,000 is especially challenging, particularly in Utah County where such listings are virtually nonexistent.
Most homes available fall between $300,000 and $700,000, a price range often out of reach for many average income earners in the area. Buyers looking for value should consider the townhouse and condominium market, where prices have softened and builder incentives abound.
Sellers face longer market times but can still expect to receive offers close to list price, especially for single-family homes. Buyers benefit from increased negotiation opportunities, including price reductions or seller concessions.
Emerging trends such as an increase in pre-foreclosure properties in Utah County could impact future inventory and pricing, particularly in both single-family and townhouse markets. Monitoring these developments is essential for both buyers and investors.
Is Utah currently a buyer’s or seller’s market?
Technically, Utah is a buyer’s market due to increased inventory and slower sales absorption. However, high prices and interest rates make it feel competitive for many buyers.
What price ranges are most homes selling for in Utah?
Approximately 70% of homes sell between $300,000 and $700,000 statewide. Homes under $300,000 are scarce, especially along the Wasatch Front and in Utah County.
Where are the best opportunities for buyers right now?
The townhouse and condominium market presents the best value opportunities, with prices dropping and builder incentives available.
How long are homes staying on the market?
Median days on market have increased, averaging around 55 days statewide and slightly less in Utah County. Townhomes and condos tend to stay on the market longer than single-family homes.
How does Utah County’s housing market compare to the rest of the state?
Utah County mirrors many statewide trends but has a slightly higher percentage of luxury home sales and a more pronounced scarcity of affordable homes under $300,000.
What should buyers and sellers do in this market?
Buyers should work with local experts to identify value opportunities and negotiate effectively. Sellers should price competitively and be prepared for longer market times. Staying informed about foreclosure trends is also advisable.
Utah’s historic homes carry a distinct architectural character shaped by regional stone, early craftsmanship, and centuries of environmental exposur
Smart home improvements do more than just lower monthly utility bills. They transform a house into a modern asset that appeals to the current generation of savvy buyers. High efficiency is now a standard expectation rather than a luxury upgrade. When you focus on the right systems, you build immediate equity while creating a more comfortable living environment for your family.

St. George summers are no joke. With temperatures regularly climbing past 105°F from June through September, a working air conditioner isn't a luxury in Southern Utah it's essential.
Utah’s spring housing market is showing signs of strain. Inventory is rising, contract cancellations are elevated, rents are softening, and buyer demand is not keeping pace with the number of homes hitting the market. For anyone asking whether Utah is shifting toward a buyer’s market, the latest signals point in that direction.
Access all your saved properties, searches, notes and more.
Access all your saved properties, searches, notes and more.
Enter your email address and we will send you a link to change your password.
I agree to receive marketing and customer service calls and text messages from Best Utah Real Estate. Consent is not a condition of purchase. Msg/data rates may apply. Msg frequency varies. Reply STOP to unsubscribe. Privacy Policy & Terms of Service.
Listings displayed on this website are provided via IDX. The website owner is not the listing broker or agent unless explicitly stated.
Your trusted MLS search companion